
The World Cup 2026 is over. Below is the basic analysis of model accuracy through the end of the tournament. The blue bars represent the distribution of expected results, the red bar represents the actual model performance and the darker blue bars represent roughly the middle 90 percent of expected results.
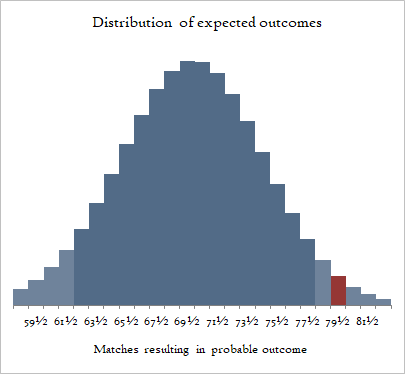
The model consistently over-predicted the match results up until the semifinals. The cumulative over-prediction was statistically significant with the 90-percent confidence interval between 62.3 and 77.8. This means that through the tournament, the FIFA rankings and my adjustments underestimated the chances the favored team had of winning the match. This effect was driven largely by the second round of the group stage, and the knockout rounds through the Quarterfinals. Indeed, the three rounds of knockout play only saw three upsets (Paraguay and Switzerland on penalty kicks and Norway in regular play) where we would have expected about 10 or 11 upsets. There were no upsets in the Quarterfinals. However, the Semifinals, the Third Place match, and the Final saw three upsets out of four matches. See the chart below where the blue line and dots with error bars represent the actual performance with 90% confidence intervals and the gray dash represents the expected model performance.
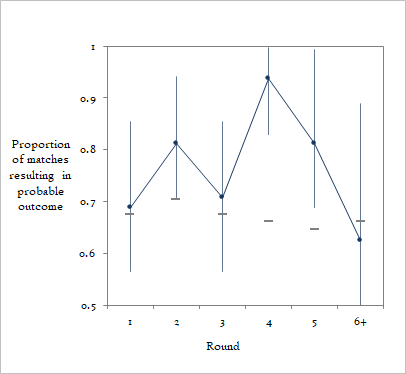
Throughout the tournament we saw an effect where when the game mattered more, the favored team performed better than the model. This held true until the final four matches where we saw three upsets. In summary, the data suggests that the FIFA rankings are good predictors for the outcome probabilities of matches for friendlies, qualifying matches, and group stage matches where a loss or tie is not a tournament-breaker.