
Last updated on 2026-07-10
Below is the basic analysis of model accuracy through the end of the Round of 32. The blue bars represent the distribution of expected results and the red bar represents the actual model performance.
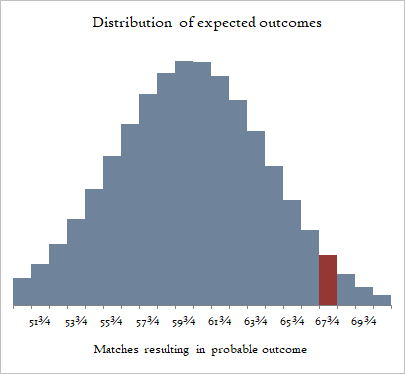
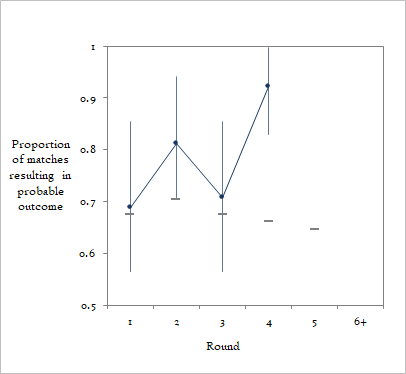
The model continues to over-predict the match results. The cumulative over-prediction is statistically significant with the 90-percent confidence interval between 53 and 67. This means that through the Round of 32, the FIFA rankings and my adjustments underestimate the chances a team has of winning the match. This effect is driven largely by the second round of the group stage and the Round of 32. Indeed, the Group of 32 only saw one upset (Germany on penalty kicks) where we would have expected five or six upsets. See the chart below where the blue line and dots with error bars represent the actual performance with 90% confidence intervals and the gray dash represents the expected model performance.
Here are the Round of 16 probabilities based on rankings updated from the Round of 32 results. Scores will be updated periodically throughout the round.
| Team | FT | ET | PK | |
|---|---|---|---|---|
| 20% | Paraguay | 0 | ||
| 80% | France | 1 | ||
| 32% | Canada | 0 | ||
| 68% | Morocco | 3 | ||
| 41% | Portugal | 0 | ||
| 59% | Spain | 1 | ||
| 47% | United States | 1 | ||
| 53% | Belgium | 4 | ||
| 68% | Brazil | 1 | ||
| 32% | Norway | 2 | ||
| 44% | Mexico | 2 | ||
| 56% | England | 3 | ||
| 77% | Argentina | 3 | ||
| 23% | Egypt | 2 | ||
| 45% | Switzerland | 0 | 0 | 4 |
| 55% | Colombia | 0 | 0 | 3 |