
Last updated on 2026-06-25
With the conclusion of the second round, below is the basic analysis of model accuracy. The blue bars represent the distribution of expected results and the red bar represents the actual model performance.

The model now seems to slightly over-predict the match results, though the over-prediction is not statistically significant. This means that through the second round, the FIFA rankings and my adjustments are good indicators of the chances a team has of winning the match.
It is interesting to note that favored teams did perform slightly better in the second round as seen in this trend chart. The dots represent the match result; 0 means the favored team lost, 0.5 means the match was a tie, and 1 means the favored team won. The heavy red line is the four-game moving average. The light gray dashed line is the expected model mean. The red dashed line is the actual model mean. The vertical lines separate the different tournament stages.
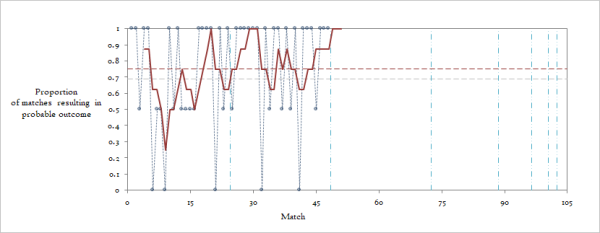
From this, we can see the favored team performance improving in the second round. Perhaps this is to be expected.
With that, here are the third round probabilities based on rankings updated from the second round results. Scores will be updated periodically throughout the round.
| Home | Away | ||||
|---|---|---|---|---|---|
| 25% | Scotland | 0 | 3 | Brazil | 75% |
| 87% | Morocco | 4 | 2 | Haiti | 13% |
| 54% | Switzerland | 2 | 1 | Canada | 46% |
| 45% | Bosnia and Herzegovina | 3 | 1 | Qatar | 55% |
| 26% | Czechia | 0 | 3 | Mexico | 74% |
| 34% | South Africa | 1 | 0 | Korea | 66% |
| 27% | Curaçao | Côte d’Ivoire | 73% | ||
| 33% | Ecuador | Germany | 67% | ||
| 65% | Japan | Sweden | 35% | ||
| 23% | Tunisia | Netherlands | 77% | ||
| 32% | Türkiye | USA | 68% | ||
| 46% | Paraguay | Australia | 54% | ||
| 24% | Norway | France | 76% | ||
| 70% | Senegal | Iraq | 30% | ||
| 48% | Egypt | IR Iran | 52% | ||
| 15% | New Zealand | Belgium | 85% | ||
| 47% | Cabo Verde | Saudi Arabia | 53% | ||
| 32% | Uruguay | Spain | 68% | ||
| 22% | Panama | England | 78% | ||
| 76% | Croatia | Ghana | 24% | ||
| 48% | Algeria | Austria | 52% | ||
| 10% | Jordan | Argentina | 90% | ||
| 47% | Colombia | Portugal | 53% | ||
| 54% | Congo DR | Uzbekistan | 46% |